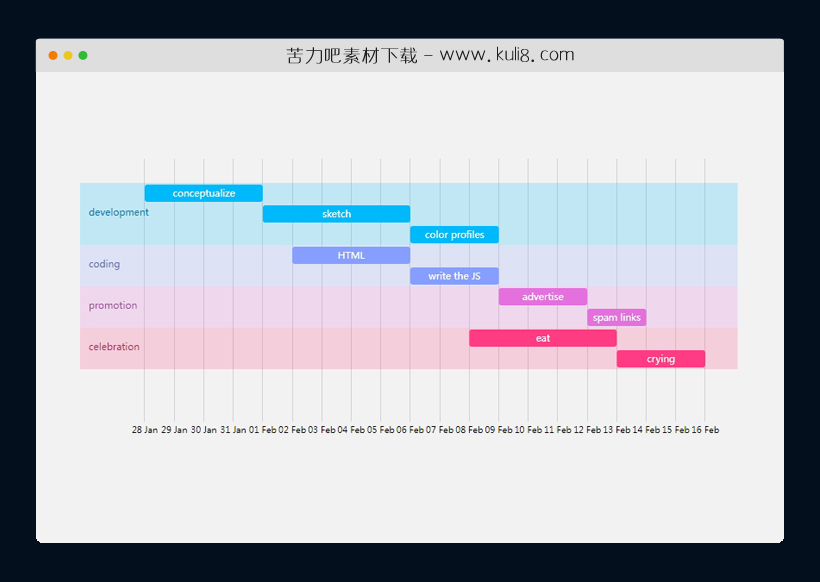

资源描述:一款可根据日期时间生成的统计图表,随着时间的推移,它将任务可视化。图表显示任务类型、开始时间和结束时间,采用了不同的颜色区分,非常实用。
使用D3JS生成交互式水平统计图特效(共3个文件)
- index.html
使用方法
var w = 800;
  var h = 400;


  var svg = d3.selectAll(".svg")
  //.selectAll("svg")
  .append("svg")
  .attr("width", w)
  .attr("height", h)
  .attr("class", "svg");


    var taskArray = [
  {
    task: "conceptualize",
    type: "development",
    startTime: "2013-1-28", //year/month/day
    endTime: "2013-2-1",
    details: "This actually didn't take any conceptualization"
},

{
    task: "sketch",
    type: "development",
    startTime: "2013-2-1",
    endTime: "2013-2-6",
    details: "No sketching either, really"
},

{
    task: "color profiles",
    type: "development",
    startTime: "2013-2-6",
    endTime: "2013-2-9"
},

{
    task: "HTML",
    type: "coding",
    startTime: "2013-2-2",
    endTime: "2013-2-6",
    details: "all three lines of it"
},

{
    task: "write the JS",
    type: "coding",
    startTime: "2013-2-6",
    endTime: "2013-2-9"
},

{
    task: "advertise",
    type: "promotion",
    startTime: "2013-2-9",
    endTime: "2013-2-12",
    details: "This counts, right?"
},

{
    task: "spam links",
    type: "promotion",
    startTime: "2013-2-12",
    endTime: "2013-2-14"
},
{
    task: "eat",
    type: "celebration",
    startTime: "2013-2-8",
    endTime: "2013-2-13",
    details: "All the things"
},

{
    task: "crying",
    type: "celebration",
    startTime: "2013-2-13",
    endTime: "2013-2-16"
},

];

var dateFormat = d3.time.format("%Y-%m-%d");

var timeScale = d3.time.scale()
        .domain([d3.min(taskArray, function(d) {return dateFormat.parse(d.startTime);}),
                 d3.max(taskArray, function(d) {return dateFormat.parse(d.endTime);})])
        .range([0,w-150]);

var categories = new Array();

for (var i = 0; i < taskArray.length; i++){
    categories.push(taskArray[i].type);
}

var catsUnfiltered = categories; //for vert labels

categories = checkUnique(categories);


makeGant(taskArray, w, h);

var title = svg.append("text")
              .text("Gantt Chart Process")
              .attr("x", w/2)
              .attr("y", 25)
              .attr("text-anchor", "middle")
              .attr("font-size", 18)
              .attr("fill", "#009FFC");


function makeGant(tasks, pageWidth, pageHeight){

var barHeight = 20;
var gap = barHeight + 4;
var topPadding = 75;
var sidePadding = 75;

var colorScale = d3.scale.linear()
    .domain([0, categories.length])
    .range(["#00B9FA", "#F95002"])
    .interpolate(d3.interpolateHcl);

makeGrid(sidePadding, topPadding, pageWidth, pageHeight);
drawRects(tasks, gap, topPadding, sidePadding, barHeight, colorScale, pageWidth, pageHeight);
vertLabels(gap, topPadding, sidePadding, barHeight, colorScale);

}


function drawRects(theArray, theGap, theTopPad, theSidePad, theBarHeight, theColorScale, w, h){

var bigRects = svg.append("g")
    .selectAll("rect")
   .data(theArray)
   .enter()
   .append("rect")
   .attr("x", 0)
   .attr("y", function(d, i){
      return i*theGap + theTopPad - 2;
  })
   .attr("width", function(d){
      return w-theSidePad/2;
   })
   .attr("height", theGap)
   .attr("stroke", "none")
   .attr("fill", function(d){
    for (var i = 0; i < categories.length; i++){
        if (d.type == categories[i]){
          return d3.rgb(theColorScale(i));
        }
    }
   })
   .attr("opacity", 0.2);


     var rectangles = svg.append('g')
     .selectAll("rect")
     .data(theArray)
     .enter();


   var innerRects = rectangles.append("rect")
             .attr("rx", 3)
             .attr("ry", 3)
             .attr("x", function(d){
              return timeScale(dateFormat.parse(d.startTime)) + theSidePad;
              })
             .attr("y", function(d, i){
                return i*theGap + theTopPad;
            })
             .attr("width", function(d){
                return (timeScale(dateFormat.parse(d.endTime))-timeScale(dateFormat.parse(d.startTime)));
             })
             .attr("height", theBarHeight)
             .attr("stroke", "none")
             .attr("fill", function(d){
              for (var i = 0; i < categories.length; i++){
                  if (d.type == categories[i]){
                    return d3.rgb(theColorScale(i));
                  }
              }
             })


         var rectText = rectangles.append("text")
               .text(function(d){
                return d.task;
               })
               .attr("x", function(d){
                return (timeScale(dateFormat.parse(d.endTime))-timeScale(dateFormat.parse(d.startTime)))/2 + timeScale(dateFormat.parse(d.startTime)) + theSidePad;
                })
               .attr("y", function(d, i){
                  return i*theGap + 14+ theTopPad;
              })
               .attr("font-size", 11)
               .attr("text-anchor", "middle")
               .attr("text-height", theBarHeight)
               .attr("fill", "#fff");


rectText.on('mouseover', function(e) {
 // console.log(this.x.animVal.getItem(this));
               var tag = "";

         if (d3.select(this).data()[0].details != undefined){
          tag = "Task: " + d3.select(this).data()[0].task + "<br/>" +
                "Type: " + d3.select(this).data()[0].type + "<br/>" +
                "Starts: " + d3.select(this).data()[0].startTime + "<br/>" +
                "Ends: " + d3.select(this).data()[0].endTime + "<br/>" +
                "Details: " + d3.select(this).data()[0].details;
         } else {
          tag = "Task: " + d3.select(this).data()[0].task + "<br/>" +
                "Type: " + d3.select(this).data()[0].type + "<br/>" +
                "Starts: " + d3.select(this).data()[0].startTime + "<br/>" +
                "Ends: " + d3.select(this).data()[0].endTime;
         }
         var output = document.getElementById("tag");

          var x = this.x.animVal.getItem(this) + "px";
          var y = this.y.animVal.getItem(this) + 25 + "px";

         output.innerHTML = tag;
         output.style.top = y;
         output.style.left = x;
         output.style.display = "block";
       }).on('mouseout', function() {
         var output = document.getElementById("tag");
         output.style.display = "none";
             });


innerRects.on('mouseover', function(e) {
 //console.log(this);
         var tag = "";

         if (d3.select(this).data()[0].details != undefined){
          tag = "Task: " + d3.select(this).data()[0].task + "<br/>" +
                "Type: " + d3.select(this).data()[0].type + "<br/>" +
                "Starts: " + d3.select(this).data()[0].startTime + "<br/>" +
                "Ends: " + d3.select(this).data()[0].endTime + "<br/>" +
                "Details: " + d3.select(this).data()[0].details;
         } else {
          tag = "Task: " + d3.select(this).data()[0].task + "<br/>" +
                "Type: " + d3.select(this).data()[0].type + "<br/>" +
                "Starts: " + d3.select(this).data()[0].startTime + "<br/>" +
                "Ends: " + d3.select(this).data()[0].endTime;
         }
         var output = document.getElementById("tag");

         var x = (this.x.animVal.value + this.width.animVal.value/2) + "px";
         var y = this.y.animVal.value + 25 + "px";

         output.innerHTML = tag;
         output.style.top = y;
         output.style.left = x;
         output.style.display = "block";
       }).on('mouseout', function() {
         var output = document.getElementById("tag");
         output.style.display = "none";

 });


}


function makeGrid(theSidePad, theTopPad, w, h){

var xAxis = d3.svg.axis()
    .scale(timeScale)
    .orient('bottom')
    .ticks(d3.time.days, 1)
    .tickSize(-h+theTopPad+20, 0, 0)
    .tickFormat(d3.time.format('%d %b'));

var grid = svg.append('g')
    .attr('class', 'grid')
    .attr('transform', 'translate(' +theSidePad + ', ' + (h - 50) + ')')
    .call(xAxis)
    .selectAll("text")
            .style("text-anchor", "middle")
            .attr("fill", "#000")
            .attr("stroke", "none")
            .attr("font-size", 10)
            .attr("dy", "1em");
}

function vertLabels(theGap, theTopPad, theSidePad, theBarHeight, theColorScale){
  var numOccurances = new Array();
  var prevGap = 0;

  for (var i = 0; i < categories.length; i++){
    numOccurances[i] = [categories[i], getCount(categories[i], catsUnfiltered)];
  }

  var axisText = svg.append("g") //without doing this, impossible to put grid lines behind text
   .selectAll("text")
   .data(numOccurances)
   .enter()
   .append("text")
   .text(function(d){
    return d[0];
   })
   .attr("x", 10)
   .attr("y", function(d, i){
    if (i > 0){
        for (var j = 0; j < i; j++){
          prevGap += numOccurances[i-1][1];
         // console.log(prevGap);
          return d[1]*theGap/2 + prevGap*theGap + theTopPad;
        }
    } else{
    return d[1]*theGap/2 + theTopPad;
    }
   })
   .attr("font-size", 11)
   .attr("text-anchor", "start")
   .attr("text-height", 14)
   .attr("fill", function(d){
    for (var i = 0; i < categories.length; i++){
        if (d[0] == categories[i]){
        //  console.log("true!");
          return d3.rgb(theColorScale(i)).darker();
        }
    }
   });

}

//from this stackexchange question: http://stackoverflow.com/questions/1890203/unique-for-arrays-in-javascript
function checkUnique(arr) {
    var hash = {}, result = [];
    for ( var i = 0, l = arr.length; i < l; ++i ) {
        if ( !hash.hasOwnProperty(arr[i]) ) { //it works with objects! in FF, at least
            hash[ arr[i] ] = true;
            result.push(arr[i]);
        }
    }
    return result;
}

//from this stackexchange question: http://stackoverflow.com/questions/14227981/count-how-many-strings-in-an-array-have-duplicates-in-the-same-array
function getCounts(arr) {
    var i = arr.length, // var to loop over
        obj = {}; // obj to store results
    while (i) obj[arr[--i]] = (obj[arr[i]] || 0) + 1; // c
站长提示:
1. 苦力吧素材官方QQ群:950875342
2. 平台上所有素材资源,需注册登录会员方能正常下载。
3. 会员用户积极反馈网站、素材资源BUG或错误问题,每次奖励2K币。
4. PHP源码类素材,如需协助安装调试,或你有二次开发需求,可联系苦力吧客服。
5. 付费素材资源,需充值后方能下载,如有任何疑问可直接联系苦力吧客服
1. 苦力吧素材官方QQ群:950875342
2. 平台上所有素材资源,需注册登录会员方能正常下载。
3. 会员用户积极反馈网站、素材资源BUG或错误问题,每次奖励2K币。
4. PHP源码类素材,如需协助安装调试,或你有二次开发需求,可联系苦力吧客服。
5. 付费素材资源,需充值后方能下载,如有任何疑问可直接联系苦力吧客服
PREVIOUS:
NEXT:
相关资源 / 图表&进度

😀
- 😀
- 😊
- 😂
- 😍
- 😑
- 😷
- 😵
- 😛
- 😣
- 😱
- 😋
- 😎
- 😵
- 😕
- 😶
- 😚
- 😜
- 😭
发表评论