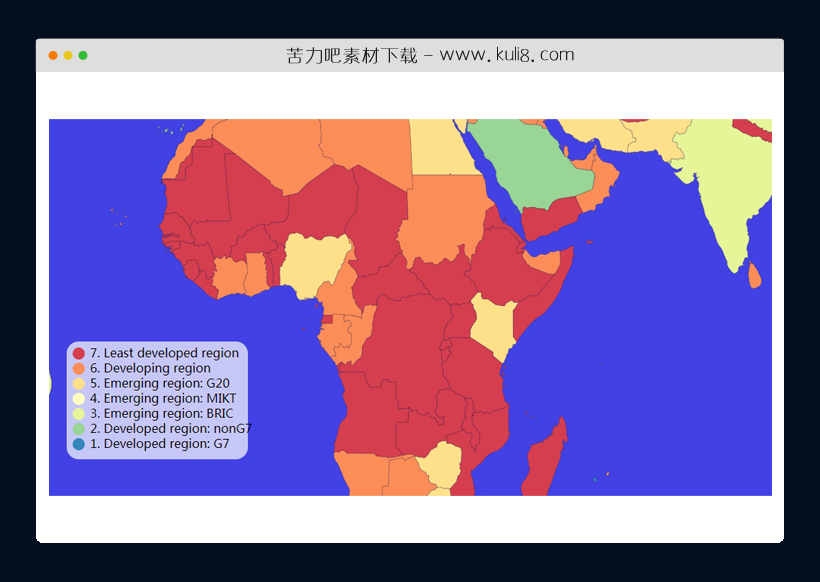

资源描述:一款可自由缩放的世界地图代码,它使用D3创建SVG元素并将其添加到DOM,加载了两个文件数据,一个TSV文件和一个JSON文件,其中包含有关世界各国的信息。根据各国的经济GDP数据用不同的背景颜色填充地图上的国家。
javascript基于D3.js库创建的可视化世界地图特效(共4个文件)
- index.html
使用方法
const svg = d3.select('svg');

const projection = d3.geoNaturalEarth1();
const pathGenerator = d3.geoPath().projection(projection);

const g = svg.append('g');

const colorLegendG = svg.append('g')
   .attr('transform', `translate(40,310)`);


g.append('path')
    .attr('class', 'sphere')
    .attr('d', pathGenerator({type: 'Sphere'}));

svg.call(d3.zoom().on('zoom', () => {
  g.attr('transform', d3.event.transform);
}));
 const colorScale = d3.scaleOrdinal();

 const colorValue = d => d.properties.economy;

const loadAndProcessData = () =>

  Promise.all([
    d3.tsv('https://unpkg.com/world-atlas@1.1.4/world/50m.tsv'),
    d3.json('https://unpkg.com/world-atlas@1.1.4/world/50m.json')
  ])

  .then(([tsvData, topoJSONdata]) => {

  const rowById = tsvData.reduce((accumulator, d) => {
    accumulator[d.iso_n3] = d;
    return accumulator;
  }, {});

  const countries = topojson.feature(topoJSONdata, topoJSONdata.objects.countries);

     countries.features.forEach(d =>{
   Object.assign(d.properties, rowById[d.id])
  });

  return countries;

});

const colorLegend = (selection, props) => {
  const {
    colorScale,
    circleRadius,
    spacing,
    textOffset,
    backgroundRectWidth
  } = props;

  const backgroundRect = selection.selectAll('rect')
    .data([null]);

  const n = colorScale.domain().length;
  backgroundRect.enter()
    .append('rect')
    .merge(backgroundRect)
    .attr('x', -circleRadius * 2)
    .attr('y', -circleRadius * 2)
    .attr('rx', circleRadius * 2)
    .attr('width', backgroundRectWidth)
    .attr('fill', 'white')
    .attr('height', spacing * n + circleRadius * 2)

  const groups = selection.selectAll('.tick')
    .data(colorScale.domain());
  const groupsEnter = groups
    .enter().append('g')
      .attr('class', 'tick');
  groupsEnter
    .merge(groups)
      .attr('transform', (d, i) =>
        `translate(0, ${i * spacing})`
      );
  groups.exit().remove();

  groupsEnter.append('circle')
    .merge(groups.select('circle'))
      .attr('r', circleRadius)
      .attr('fill', colorScale);

  groupsEnter.append('text')
    .merge(groups.select('text'))
      .text(d => d)
      .attr('dy', '0.32em')
      .attr('x', textOffset);
}

  loadAndProcessData().then(countries => {
  console.log(colorScale);
 colorScale.domain(countries.features.map(colorValue))
    .domain(colorScale.domain().sort().reverse())
    .range(d3.schemeSpectral[colorScale.domain().length]);

  colorLegendG.call(colorLegend, {
  colorScale,
  circleRadius: 8,
  spacing: 20,
  textOffset: 15,
  backgroundRectWidth: 240
});

  g.selectAll('path').data(countries.features)
    .enter().append('path')
      .attr('class', 'country')
      .attr('d', pathGenerator)
      .attr('fill', d => colorScale(colorValue(d)))
    .append('title')
      .text(d => d.properties.name + ' : ' + colorValue(d));

});
站长提示:
1. 苦力吧素材官方QQ群:950875342
2. 平台上所有素材资源,需注册登录会员方能正常下载。
3. 会员用户积极反馈网站、素材资源BUG或错误问题,每次奖励2K币。
4. PHP源码类素材,如需协助安装调试,或你有二次开发需求,可联系苦力吧客服。
5. 付费素材资源,需充值后方能下载,如有任何疑问可直接联系苦力吧客服
1. 苦力吧素材官方QQ群:950875342
2. 平台上所有素材资源,需注册登录会员方能正常下载。
3. 会员用户积极反馈网站、素材资源BUG或错误问题,每次奖励2K币。
4. PHP源码类素材,如需协助安装调试,或你有二次开发需求,可联系苦力吧客服。
5. 付费素材资源,需充值后方能下载,如有任何疑问可直接联系苦力吧客服
PREVIOUS:
NEXT:
相关资源 / 地图&标注
😀
- 😀
- 😊
- 😂
- 😍
- 😑
- 😷
- 😵
- 😛
- 😣
- 😱
- 😋
- 😎
- 😵
- 😕
- 😶
- 😚
- 😜
- 😭
发表评论